In this chapter you’ll learn how to use DreamFactory’s API limiting and logging capabilities to assign and monitor access to your restricted APIs.
Logging
Whether you’re debugging API workflows or conforming to regulatory requirements, logging is going to play a crucial role in the process. In this section we’ll review various best practices pertaining to configuring and managing both your DreamFactory platform logs and logs managed through DreamFactory’s Elastic Stack integration.
Introducing the DreamFactory Platform Logs
DreamFactory developers and administrators will often need to debug platform behavior using informational and error messages. This logging behavior can be configured within your .env file or within server environmental variables. If you open the .env file you’ll find the following logging-related configuration parameters towards the top of the file:
APP_DEBUG: When set totrue, a debugging trace will be returned if an exception is thrown. While useful during the development phase, you’ll undoubtedly want to set this tofalsein production.APP_LOG: DreamFactory will by default write log entries to a file nameddreamfactory.logfound instorage/logs. This is known as single file mode. You can instead configure DreamFactory to break log entries into daily files such asdreamfactory-2019-02-14.logby settingAPP_LOGtodaily. Keep in mind however that by default only 5 days of log files are maintained. You can change this default by assigning the desired number of days toAPP_LOG_MAX_FILES. Alternatively, you could send log entries to the operating system syslog by settingAPP_LOGtosyslog, or to the operating system error log usingerrorlog.APP_LOG_LEVEL: This parameter determines the level of log sensitivity, and can be set toDEBUG,INFO,NOTICE,WARNING,ERROR,CRITICAL,ALERT, andEMERGENCY. DreamFactory can be very chatty when this parameter is set toDEBUG,INFO, orNOTICE, so be wary of using these settings in a production environment. Also, keep in mind these settings are hierarchical, meaning if you setAPP_LOG_LEVELtoWARNINGfor instance, then allWARNING,ERROR,CRITICAL,ALERT, andEMERGENCYmessages will be logged.
Here’s an example of typical output sent to the log:
[2019-02-14 22:35:45] local.DEBUG: API event handled: mysql._table.{table_name}.get.pre_process
[2019-02-14 22:35:45] local.DEBUG: API event handled: mysql._table.employees.get.pre_process
[2019-02-14 22:35:45] local.DEBUG: API event handled: mysql._table.{table_name}.get.post_process
[2019-02-14 22:35:45] local.DEBUG: API event handled: mysql._table.employees.get.post_process
[2019-02-14 22:35:45] local.DEBUG: Service event handled: mysql._table.{table_name}.get
[2019-02-14 22:35:45] local.DEBUG: Logged message on [mysql._table.{table_name}.get] event.
[2019-02-14 22:35:45] local.DEBUG: Service event handled: mysql._table.{table_name}.get
[2019-02-14 22:35:45] local.DEBUG: Service event handled: mysql._table.employees.get
[2019-02-14 22:35:45] local.INFO: [RESPONSE] {"Status Code":200,"Content-Type":null}
[2019-02-14 22:35:45] local.INFO: [RESPONSE] {"Status Code":200,"Content-Type":"application/json"}
Logstash
DreamFactory’s Gold edition offers Elastic Stack (Elasticsearch, Logstash, Kibana) support via the Logstash connector. This connector can interface easily with the rest of the ELK stack (Elasticsearch, Logstash, Kibana) from Elastic.io or connect to other analytics and monitoring sources such as open source Grafana.
Tip
If you’re new to Logstash and are searching for an easy and cheap way to get started, we recommend following along with the excellent Digital Ocean tutorial titled How to Install Elasticsearch, Logstash, and Kibana on Ubuntu 18.04.To enable the Logstash connector you’ll begin as you would when configuring any other service. Navigate to Services, then Create, then in the Service Type select box choose Log > Logstash. Then, add a name, label, and description as you would when configuring other services:
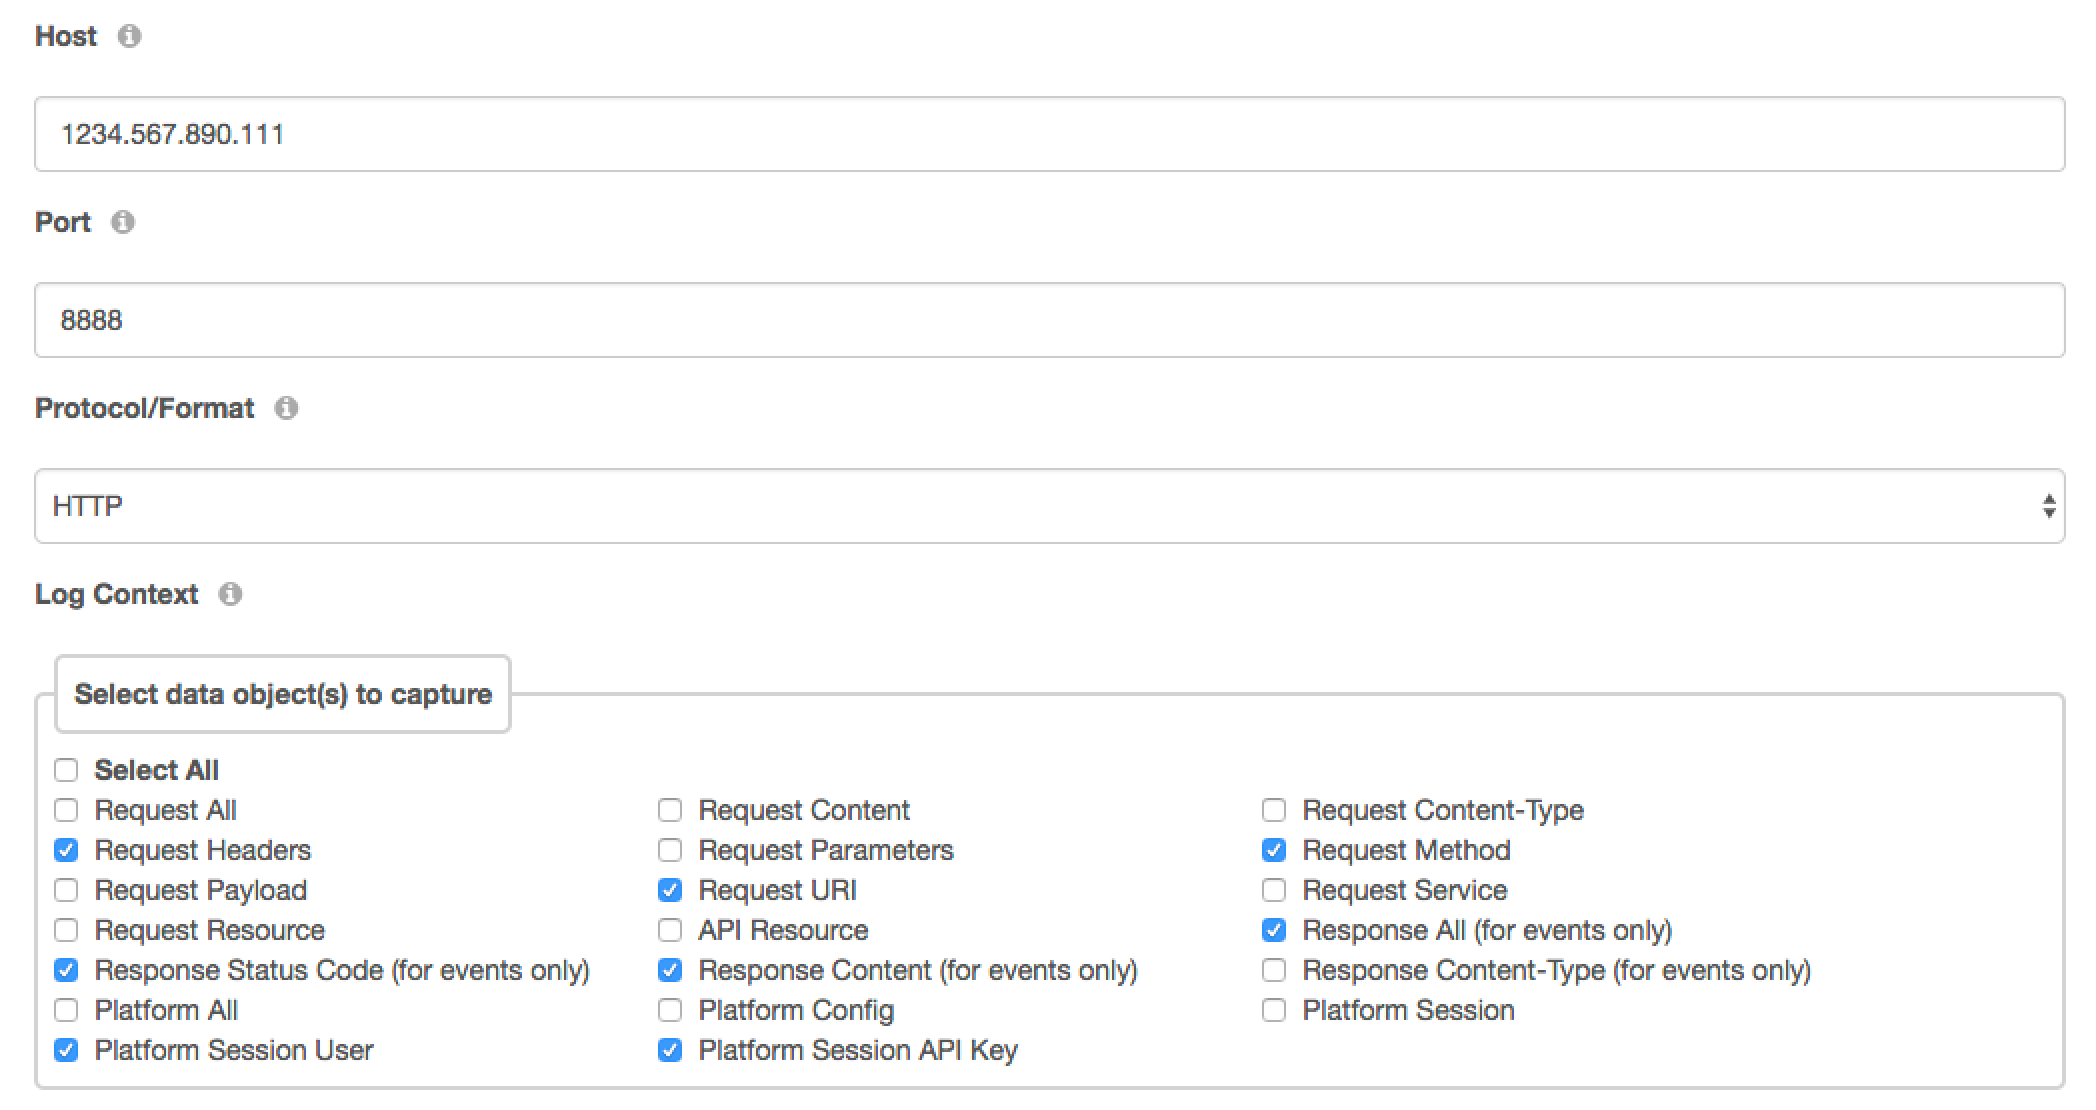
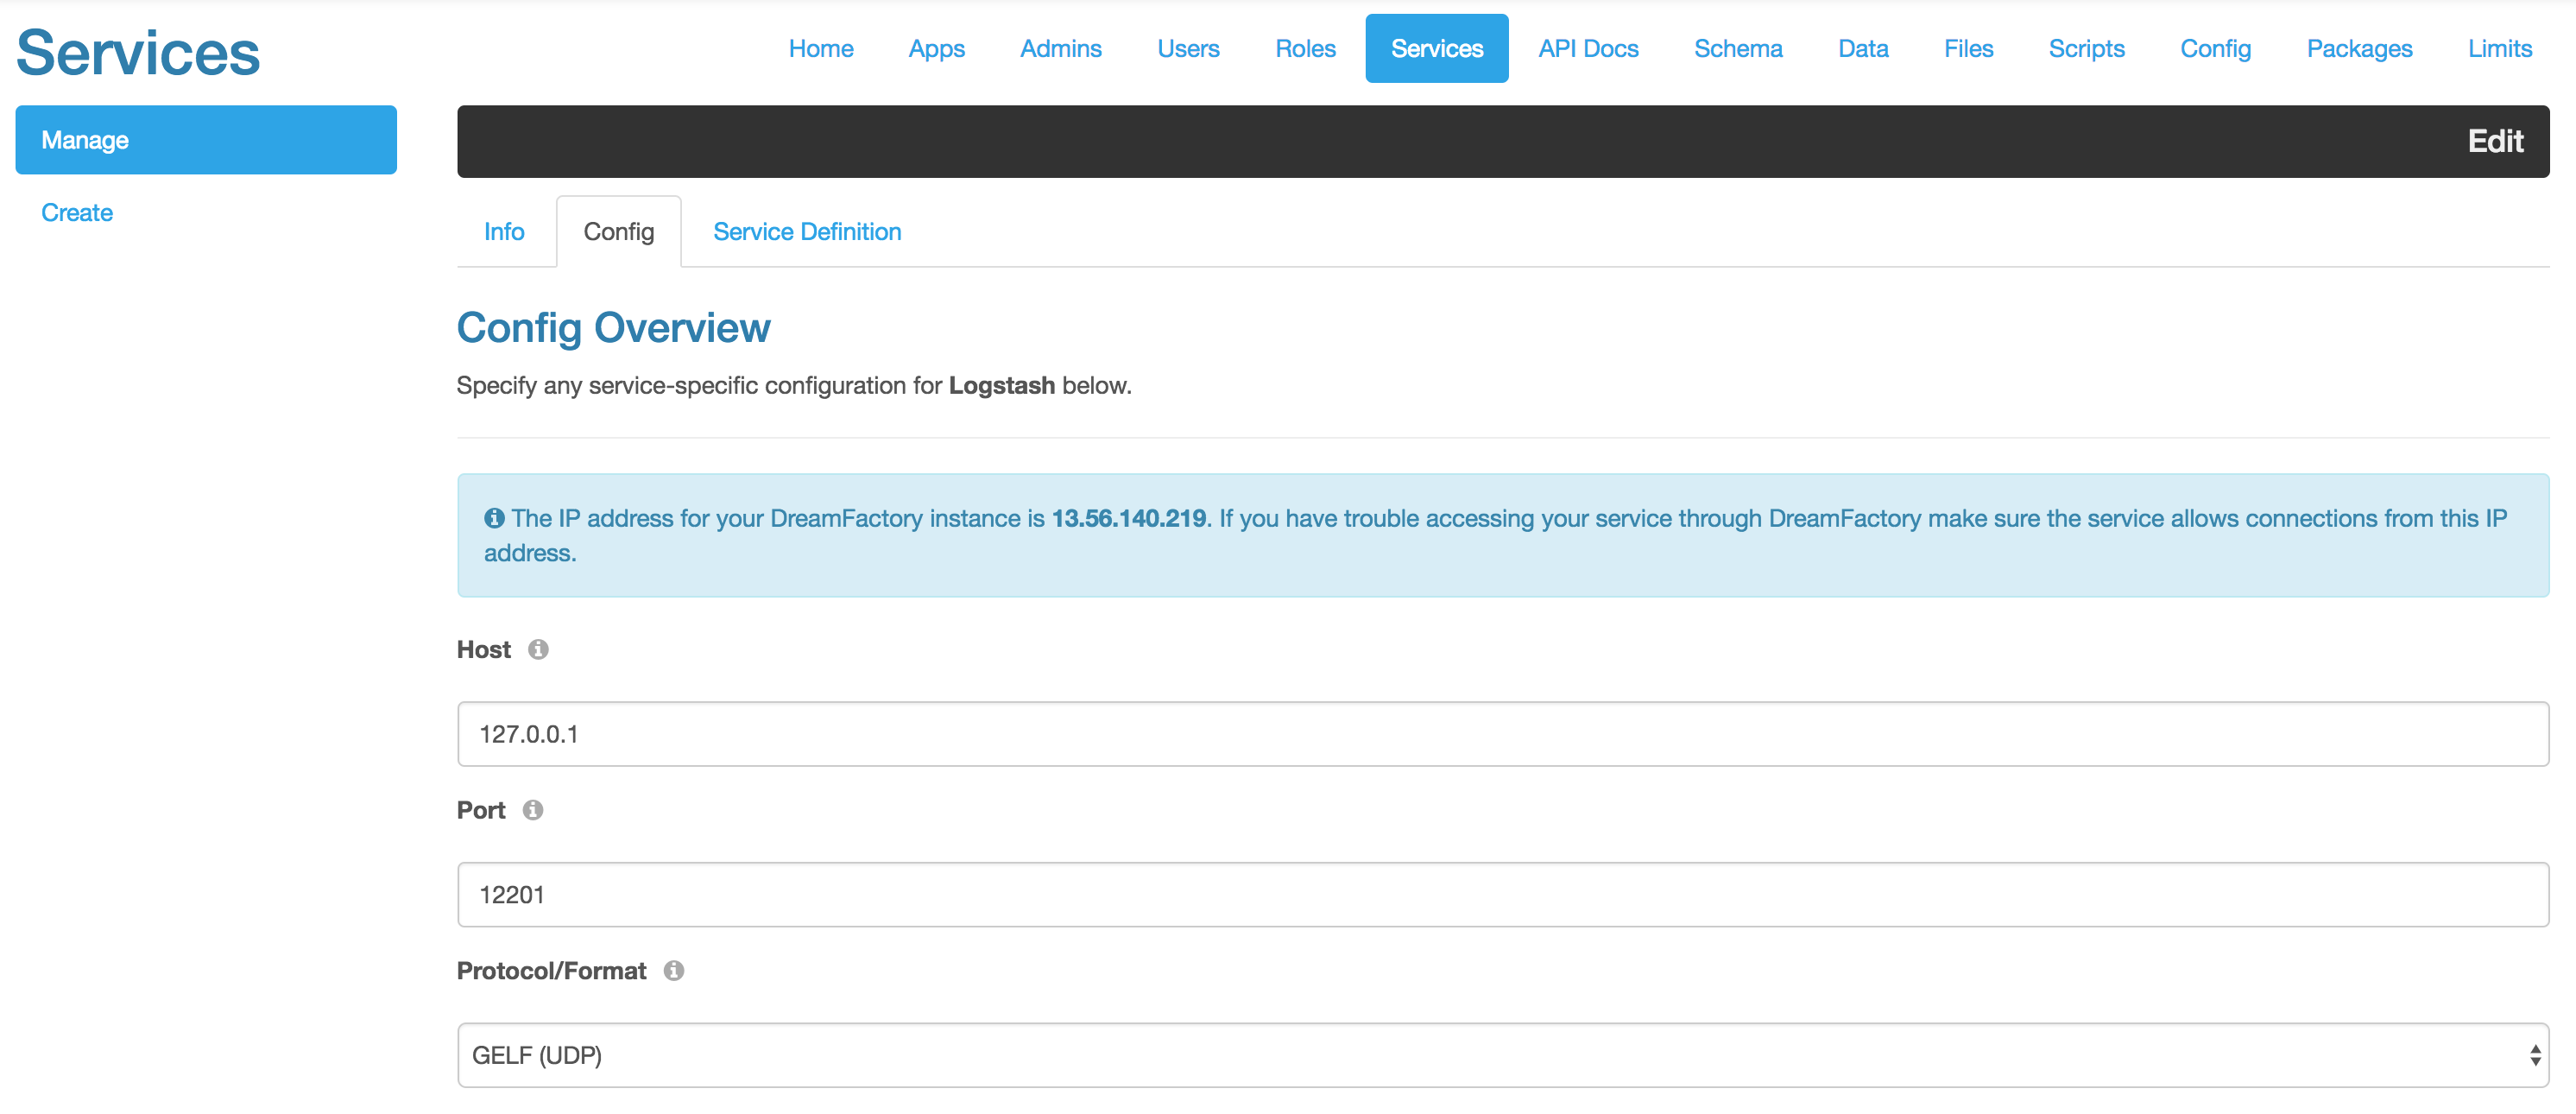
Next, navigate to the “Config” tab at the top of the service creation page. In the next two screenshots you can see the fields and options you will need to select. In the first screenshot, you will add the host. In this case, I am hosting the Logstash connector locally, on my DreamFactory instance. The other optionss are the Port and Protocol/Format. The port corresponds to the port in which your Logstash daemon is running. The Protocol/Format field should be set to match the protocol/format for which your Logstash service is configured to accept input:
- GELF (UDP): GELF (GrayLog Extended Format) was created as an optimized alternative to syslog formatting. Learn more about it here.
- HTTP: Choose this option if your Logstash service is configured to listen on HTTP protocol. DreamFactory will send the data to Logstash in JSON format.
- TCP: Choose this option if your Logstash service is configured to listen on TCP protocol. DreamFactory will send the data to Logstash in JSON format.
- UDP: Choose this option if your Logstash service is configured to listen on UDP protocol. DreamFactory will send the data to Logstash in JSON format.
In this second screenshot, you can see some of the logging options available to you via the Logstash connector. I have also added a few services that I would like to log. You can pick various levels information you would like to log. For more detailed information, please see this article. Valid options are:
- fatal
- error
- warn
- info
- debug
- trace
- info
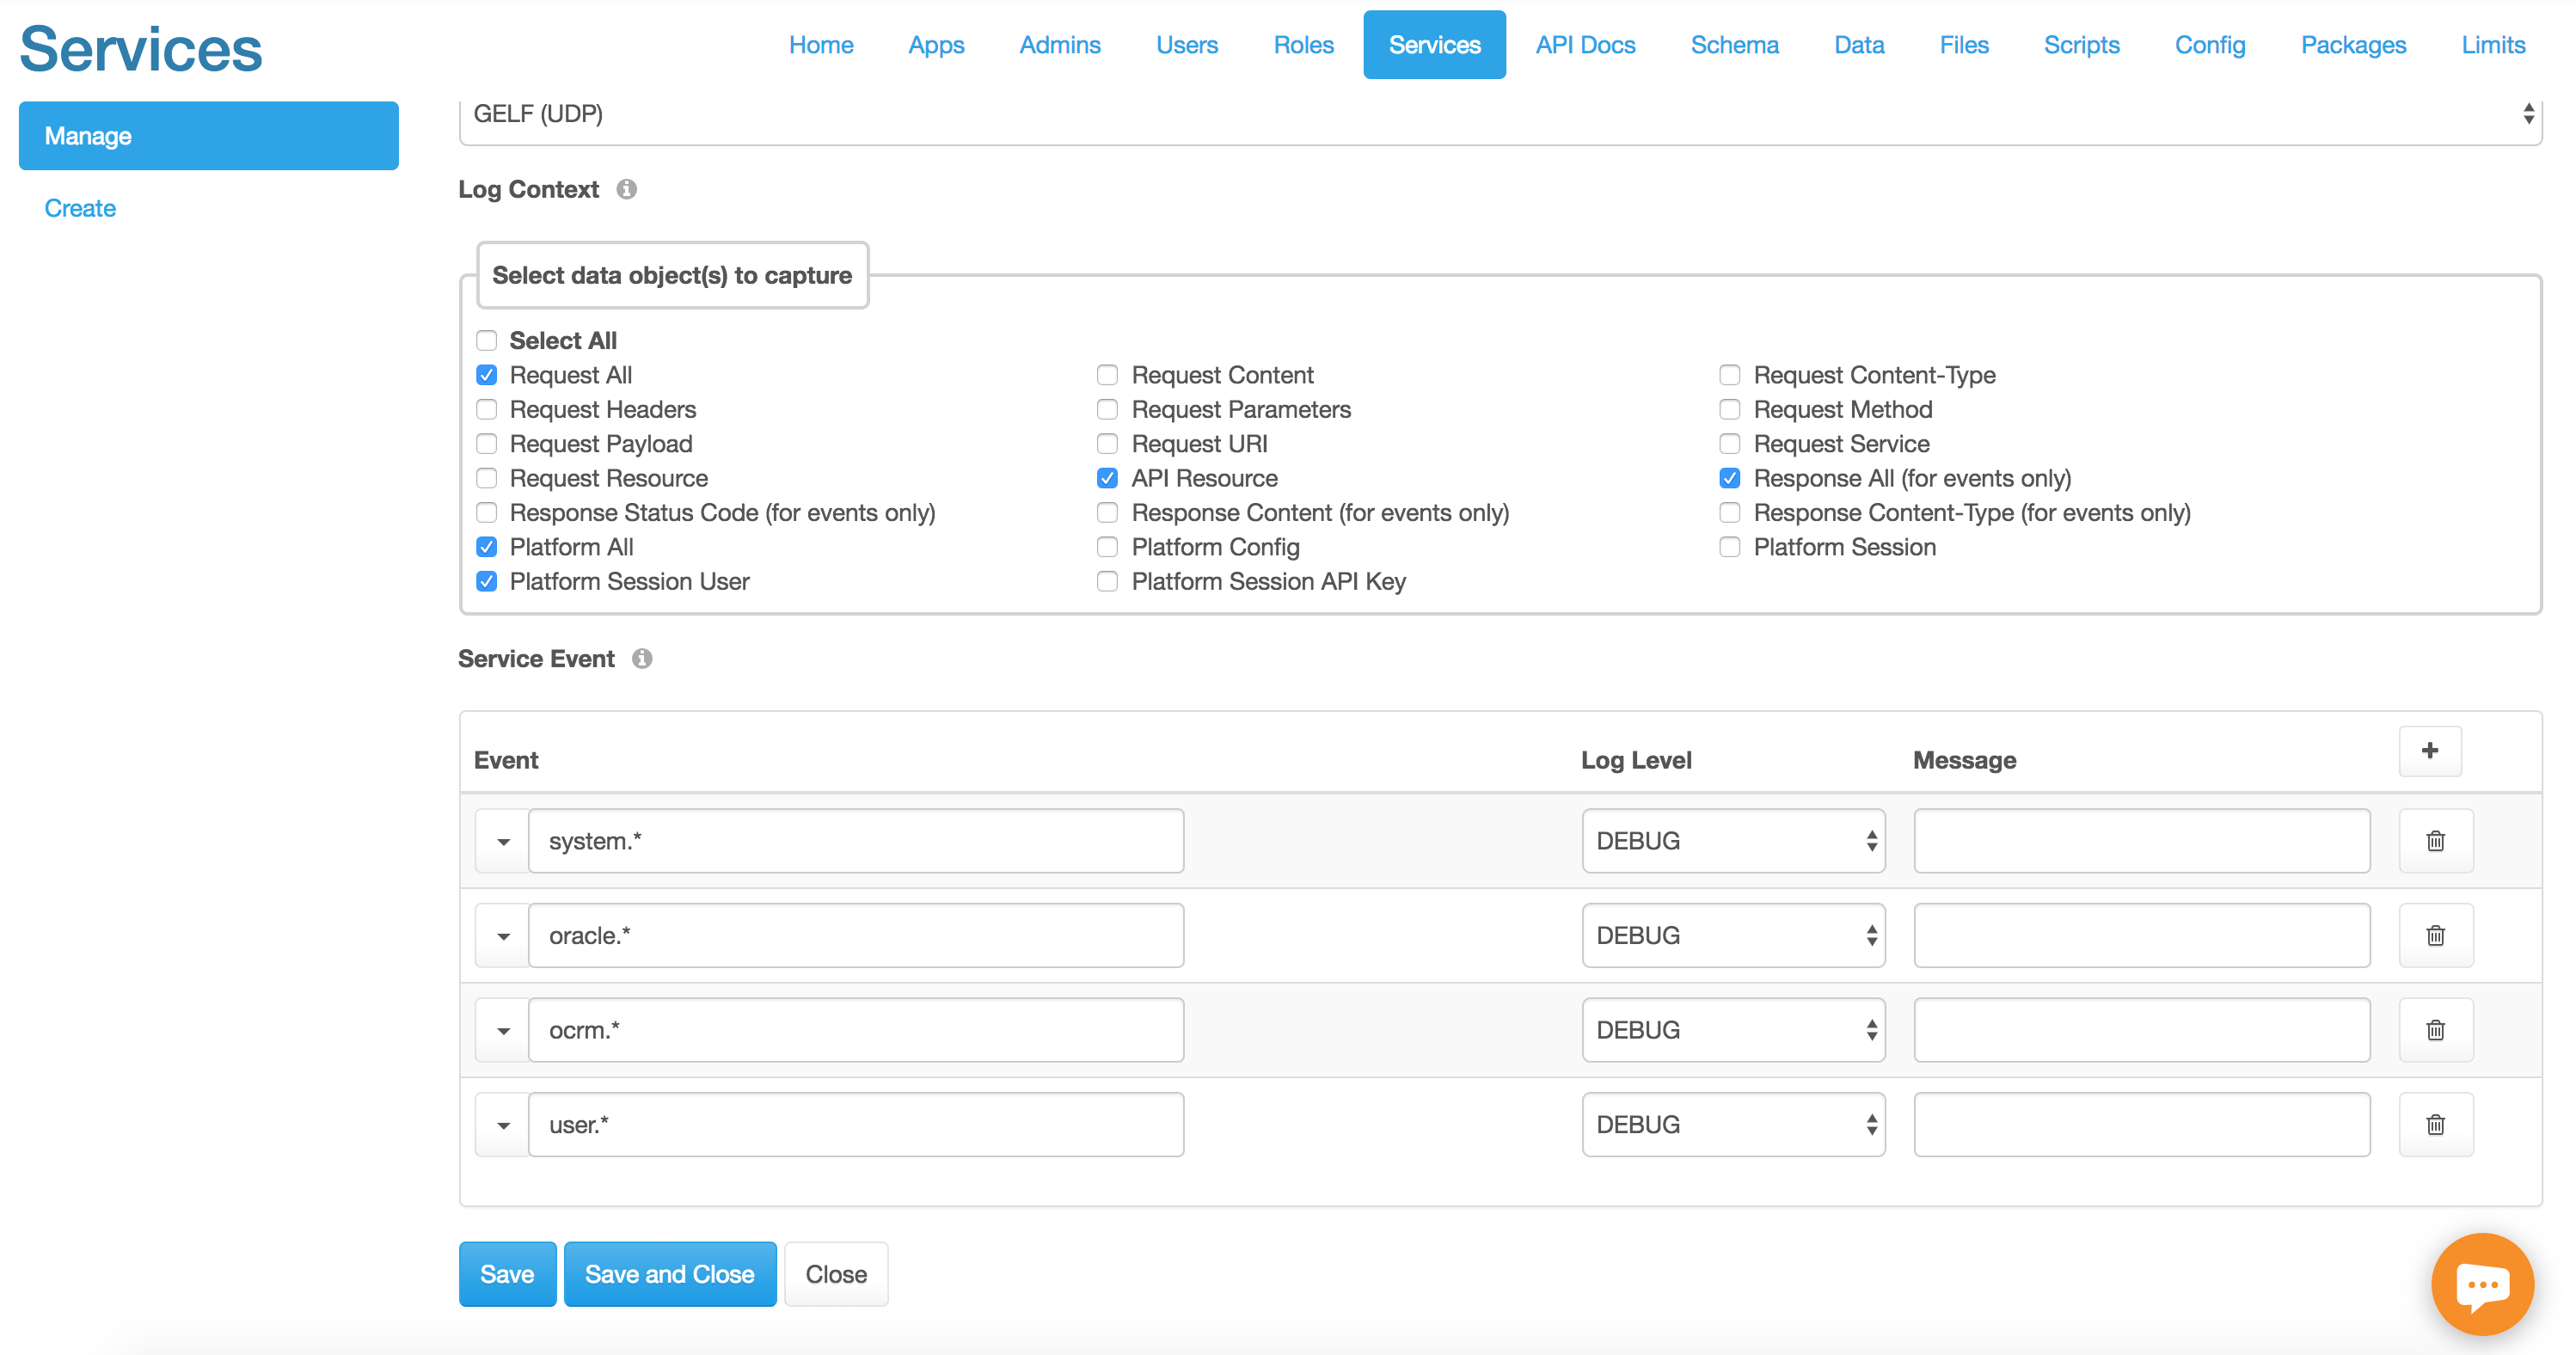
Default Data Objects that can be Captured

The screenshot above shows the default data objects we can catch and send to logstash by selecting the appropiate checkbox. (We can also create scripts to send custom data to logstash which will be explained further below). These data objects can be seperated into three “sections”, Request, Response, and Platform. “Request” and “Response” will be sent to logstash within an “event” object, and “Platform” in its own object, i.e in the following manner:
{
  ...,
  ...,
  "event": {
    "request": {
      "key": "value",
      "key": "value"
    },
    "response": {
      "key":"value",
      "key":"value"
    }
  },
  "platform": {
    "key":"value",
  }
}
Request
Data objects that can be captured within the “Request” section are as follows:
| Data Object | Will Provide |
|---|---|
| Content | The body of your api call (if any). For example the resource sent in a POST request. |
| Content-Type | The entity type, generally application/json |
| Headers | Will include all headers including host, origin, accept-enconding, accept, user-agent, referer, connection, content-type, x-dreamfactory-api-key, x-dreamfactory-session-token, accept-language, content-length |
| Parameters | Any parameters added to the api request such as fields, filter, and order |
| Method | i.e GET, POST etc. |
| Payload | The resource been sent in the api call as a JSON object (such as in a POST request) |
| URI | The uri of the request starting with api/v2/ |
| Service | The name of the api service being called, e.g. if you have a mysql connector called “mysql-db” it will display mysql-db |
| Resource | The endpoint being called of that service, e.g. _table/employees?limit=1 |
| All | All of the above |
Note: The API Resource option will show the endpoint of the service being called (e.g employees if calling the employees table in a database). It will not be nested inside the ‘request’ object.
Response
Data objects that can be captured within the “Response” section are as follows:
| Data Object | Will Provide |
|---|---|
| Status Code | The status code of the event (eg 200 for succesful, 401 for unauthorized ) |
| Content | A JSON object of the response content (such as the first employee details in a call to /employeeslimit=1) |
| Content-Type | The entity type, generally application/json |
| All | All of the above |
Platform
Data objects that can be captured within the “Platform” section are as follows:
| Data Object | Will Provide |
|---|---|
| Config | Configuration of the DreamFactory Platform, e.g. scripting language paths, storage paths, whether windows authorization is enabled etc. |
| Session | Will return the session_token, whether a role has been assigned to the service, and details of the dreamfactory user making the call. |
| Session User | Details of the user making the call (e.g username, email, whether they are an admin etc.) |
| Session API Key | The API key being used (this will be associated with the Role and its correspondong App) |
| All | All of the above |
Custom Logstash Messages
Using DreamFactory’s scripting service we can send customized logs to logstash through a simple internal POST call. This can be a powerful tool as we can send additional information to logstash that otherwise might not be provided in a regular api call, or indeed we might want a simpler, more human message than what is provided in an api response.
For example, whenever a new user is created, we may want to send that information, along with details of who created that user to logstash. We can do so by adding the following script to our system.user.post endpoint:
(Replace <theNameOfYourLogstashService> with the name you assigned to your Logstash Service in DreamFactory).
As can be seen above, the POST call takes two arguments, the url of the logstash connector (which we can make with an internal call so only the name of the logstash service is necessary) plus the log itself which should be an array containing the level and the message. The message can be interpolated to contain any variable you create.
Filtering Sensitive Data from Elastic Stack
Sensitive information such as social security numbers, dates of birth, and genetic data must often be treated in a special manner and often altogether excluded from log files. Fortunately Logstash offers a powerful suite of features for removing and mutating data prior to its insertion within Elasticsearch. For instance, if you wanted to prevent API keys from being logged to Elasticsearch you could define the following filter:
filter {
  json {
    source => "message"
    remove_field => ["[_platform][session][api_key]", "[_event][request][headers][x-dreamfactory-api-key]"]
  }
}
Configuring Logstash with Splunk
As an alternative to the ELK stack, it is possible to hook Logstash up with Splunk to index your DreamFactory logs. The process is relatively simple, however will require some minor modification to your logstash configuration. For the purposes of this tutorial, we will be using Splunk Cloud, although it is a similar process for Splunk Enterprise.
- In the Splunk Dashboard, go to
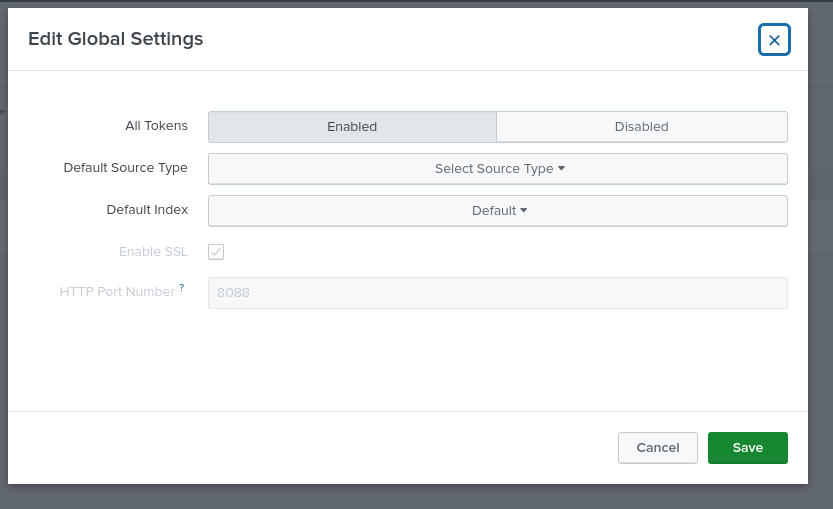
Settings->Data inputs->Http Event Collector. First, check and amend the “Global Settings”, making sure that “All Tokens” are enabled, and, if you wish, setup your “Default Source Type” and “Default Index” accordingly (they do not need to be assigned).
- Click “New Token”, and follow the prompts, assigning a Name, Source name override if you wish, and a description. Then choose your allowed index, for this example we will use the “main” index. Generate your token, and copy paste it somewhere for later. You will end up with something like the below screenshot (which can be found by clicking on your token in the HTTP Event Collector dashboard):
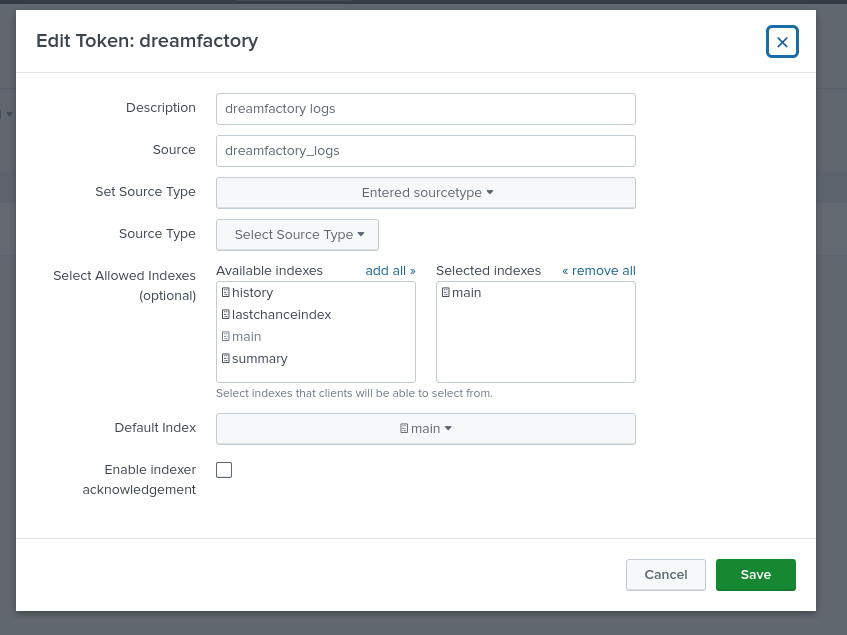
- For your Logstash configuration file, we will use
httpfor our output, turn off ssl verification for testing purposes, and amend our DreamFactory “message” object (which is what comes into Logstash) to “event” (which is what Splunk accepts). So our bare-bones configuration file will look something like this:
# What logstash is listening on, and what DreamFactory is sending to:
input {
  http {
    host => "127.0.0.1"
    port => "12201"
  }
}

output {

  http {
    # ssl verification is turned off just for testing.
    ssl_verification_mode => none
    format => "json"
    http_method => "post"
      # Splunk Cloud's port by default will be 8088. /services/collector is where to send our logs to.
      url => "<splunkURL>:<port>/services/collector"
      # Your token should be preceeded by "Splunk " (the space is important!)
      headers => ["Authorization", "Splunk <splunkToken>"]
      mapping => {
        # We will send our "message" to splunk, but the root key needs to be renamed to "event"
        "event" => "%{message}"
      }
  }
}
Remember!
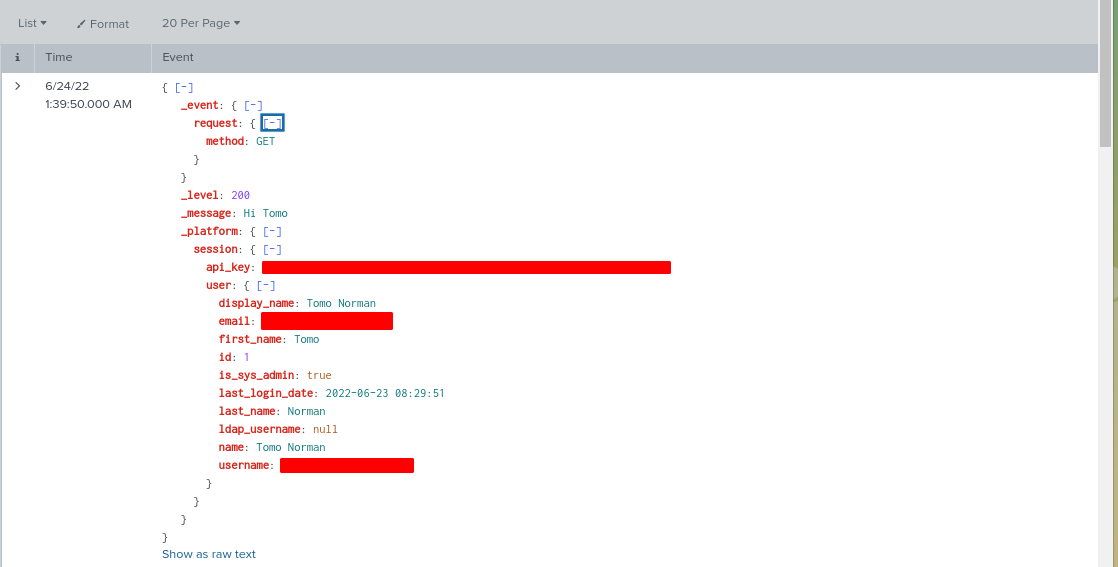
SSL verification is turned off just for our testing / dev environments. You will not want this off in production!- With our Logstash server running, and DreamFactory configured appropiately, you should now see logs appearing in Splunk’s “main” index. You can see this by clicking on “Search and Reporting” in the Splunk dashboard and running a search on
index="main". Here is a picture of the DreamFactory Configuration:
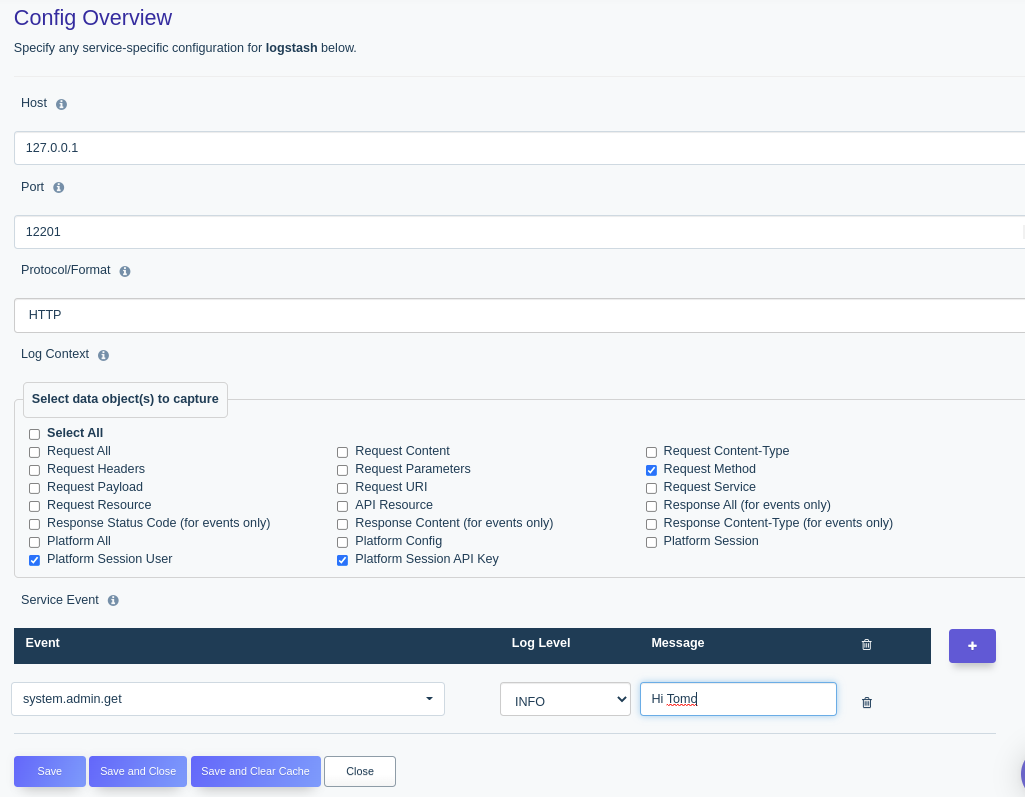
and the data that is sent to Splunk whenever the system/admin endpoint is called via a GET request.
Troubleshooting Your Logstash Environment
If you’re not seeing results show up within Kibana, the first thing you should do is determine whether Logstash is talking to Elasticsearch. You’ll find useful diagnostic information in the Logstash logs, which are found in LS_HOME/logs or possibly within /var/log/logstash. If your Logstash environment is unable to talk to Elasticsearch you’ll find an error message like this in the log:
[2019-02-14T16:20:24,403][WARN ][logstash.outputs.elasticsearch] Attempted to resurrect connection to dead ES instance, but got an error
If Logstash is unable to talk to Elasticsearch and the services reside on two separate servers, the issue is quite possibly due to a firewall restriction.
Additional Logstash Resources
- Logstash Performance Tuning
- Elastic Stack GDPR Compliance
- DreamFactory Security Whitepaper
- Logz.io Blog Post
DreamFactory API Rate Limiting
DreamFactory limits can be set for a specific user, role, service, or endpoint. Additionally, you can set limits for each user, where every user will get a separate counter. Limits can be created to only interact with a specific HTTP verb, such as a GET or you could create another limit for a POST to a specific service. Endpoint limits also provide yet another powerful way to restrict at a granular level within your DreamFactory instance.
Limits Hierarchy
Limits can be created to cover an entire instance or provide coverage down to a specific endpoint. When limits are combined, a type of limits hierarchy is created where the broader limits can sometimes override the more granular ones. Take for example a limit created for the entire instance with 500 hits per minute. If a limit is created for a specific service for 1,000 hits per minute, the instance limit would issue a 429 HTTP (over limit) error at 500 hits within a minute, so the service limit would never ever reach 1,000. Make sure to keep the big picture in mind when creating multiple limits and planning your limits strategy. Set the more broad-based limit types at an appropriate level to the more granular ones.
Limit Types
Each API limit is based on a specific period of time when the limit expires and resets. Options here are configurable and include minute, hour, day, 7-day (week), and 30-day (month). The variety of limit types in combination with limit periods allows for a wide range of control over your instance. The following table provides an overview of the different types of limits available.
| Limit Type | Description |
|---|---|
| Instance | Controls rate limiting over the entire instance to include all services, roles, and users. Limit counter here is cumulative, regardless of user, service, etc. |
| User | Provides rate limit control to a specified user. In the case where both a User limit and an Each User limit is set, the user-specific limit will override Each User in terms of rate. However, both counters will still increment. |
| Each User | Sets a rate limit for each user. The main difference between this and the entire instance is that every user gets a separate counter. |
| Role | Enable rate limiting by a specified role. |
| Service | Enable rate limiting by a specified service. |
| Service by User | Enable rate limiting for a specific user on a specific service. |
| Service by Each User | Enable rate limiting for each user on a specific service. |
| Endpoint | Enable rate limiting by a specified endpoint. |
| Endpoint by User | Enable rate limiting for a specific user on a specific endpoint. |
| Endpoint by Each User | Enable rate limiting for each user on a specific endpoint. |
| Limit Periods | Limit periods include minute, hour, day, 7-day (week), and 30-day (month). The limit period determines how long the limit remains in effect until automatically resetting after the period has expired. |
Limits via API
Like all other services in DreamFactory, limits can be managed via the API alone, provided that the user has the appropriate permissions to the system/ resource. Limits can be managed from the following endpoints:
api/v2/system/limit- Endpoints to manage CRUD operations for limits.api/v2/system/limit_cache- Endpoints to check current limit volume levels and reset limit counters manually.
Creating Limits
Limits are created by sending a POST to /api/v2/system/limit. To create a simple instance limit, POST the following resource to the endpoint:
| Limit Type | API “type” Parameter | Additional Required Params * |
|---|---|---|
| Instance | instance | N/A |
| User | instance.user | user_id |
| Each User | instance.each_user | N/A |
| Service | instance.service | service_id |
| Service By User | instance.user.service | user_id, service_id |
| Service by Each User | instance.each_user.service | service_id |
| Endpoint | instance.service.endpoint | service_id, endpoint |
| Endpoint by User | instance.user.service.endpoint | user_id, service_id, endpoint |
| Endpoint by Each User | instance.each_user.service.endpoint | service_id, endpoint |
| Role | instance.role | role_id |
Standard required parameters include: type, rate, period, and name. Below is a table which describes all of the available parameters that can be passed when creating limits.
| Parameter | Type | Required | Description |
|---|---|---|---|
| type | {string} | Yes | The type of instance you are creating. See table above for a detailed description |
| key_text | {string} | N/A | Informational field only. This key is built automatically byt the system and is a unique identifier for the limit. |
| rate | {integer} | Yes | Number of allowed hits during the limit period. |
| period | {enum} | Yes | Period where limit automatically resets. Valid values are: ‘minute’, ‘hour’, ‘day’, ‘7-day’, ‘30-day’ |
| user_id | {integer} | (see above table) | Id of the user for user type limits. |
| role_id | {integer} | (see above table) | Id of the role for role type limits. |
| service_id | {integer} | (see above table) | Id of the service for service and endpoint type limits. |
| name | {string} | Yes | Arbitrary name of the limit (required). |
| description | {string} | No | Limit description (optional) |
| is_active | {boolean} | No | Defaults to true. Additionally, you can create a limit that is in an “inactive” state which can be activated later (optional). |
| create_date | {timestamp} | N/A | Informational only. |
| last_modified_date | {timestamp} | N/A | Informational only. |
| endpoint | {string} | (see above table) | Endpoint string (see table above when required). Additionally, reference the section on Endpoint Limits for additional information. |
| verb | {enum} | No | Defaults to all verbs. Passing an individual verb will only set the limit for those requests. Can be specified with any limit type. Valid values are: GET, POST, PUT, PATCH, DELETE |
User vs. Each User Limits
You can assign a limit to a specific user for the entire instance, a particular service, or a specific endpoint. This type of limit will only affect a single user, not the entire instance, service, or endpoint. Each User type limits can also be created for these as well, the main difference being that in an Each User limit, every user will get a separate counter. For example, if you set a limit on a particular service and set the rate at 1,000 hits per day, a single user can reach the limit and it would affect any subsequent requests coming in to that service, regardless of user. In an Each User Service type limit, every user will get a separate counter to reach the 1,000 per day. This also works the same with the other limit types.
Service Limits
When you create a service limit, you are limiting based on a specific service. To create this type of limit, pass in the id of the service you want to create.
Role Limits
Role limits are much the same as the service limits, but combined with the security settings in Role, you can create some really powerful role-based limit combinations.
Endpoint Limits
Endpoint limits allow an API administrator to get very granular on what type of requests can be singled out for limiting. Basically anything available in the API Docs tab of the Admin Application can be used as an endpoint limit. Endpoint limits can, and in some cases should be combined with a specific verb. Since all of the endpoints within DreamFactory are tied into services, a service_id is required when creating endpoint limits. So, if you are targeting db/_table/contact, you will need to select the db service by id and the supply the rest of the endpoint as a string. Example:
Creating the type of limit as shown in the example above would only hit if the specific resource of the request coming in matches exactly the stored limit. Therefore, only _table/contact would increment the limit counter, not _table/contact/5 or further variations on the endpoint’s parameters.
Wildcard Endpoints
Because there may be a situation where you want to limit an endpoint and all variations on the endpoint as well, we have built in the ability to add wildcards to your endpoint limits. So, by adding a wildcard * character to your endpoint, you are creating an endpoint limit that will hit with the specific endpoint as well as any additional parameters. Every endpoint limit is associated with a service. Therefore, endpoint limits are simply an extension of a service type limit. A service limit will provide limit coverage to every endpoint under the service, whereas the endpoint limit is more targeted. Combined with wildcards and specific verbs, endpoint limits become very powerful.
Limit Cache
By default, Limits use a file-based cache storage system. Garbage collection is automatic and is based on the limit period. You can poll the limit cache system via API in order to get the current hit count for each limit. The GET call to system/limit_cache will provide the Id of the limit, a unique key, the max number of attempts and the current attempt count, as well as remaining attempts in the limit period.
Clearing Limit Cache
Clearing the limit cache involves resetting the counter for a specific limit. Additionally, all limit counters can be reset at once by passing a allow_delete=true parameter to the system/limit_cache endpoint. Passing the Id of a specific limit to the system/limit_cache endpoint, such as system/limit_cache/11 will only clear the limit counter for that particular limit.
Limit Cache Storage Options
By default, the limit cache uses file-based caching. This file cache is separate from the DreamFactory (main) cache so that when cache is cleared in DreamFactory, limit counts are not affected. Redis can also be used with the limit cache. Please see the .env-dist file for limit cache options.